As every year around this time, university campuses are buzzing with students who are starting their studies or returning to the campus after the summer break – this incredible transformation pours life into buildings – empty spaces become lecture theatres, seminar rooms and labs. Students have the opportunity to learn many new things about the subject they chose to study and also engage with the academic environment more generally. Among the educational and development opportunities students have at the university one transferable skill stands out: statistical literacy.
Numbers are an essential part of our everyday life. We count the coins in our pocket, the minutes before the next bus arrives or the sunny days in a rainy year. Numbers and quantitative information are also very important for students and educators. Statistical literacy – the ability to produce and interpret quantitative information – belongs to the basic set of academic skills that, despite its importance, may not always receive the attention it deserves.
Many students (and academics) are afraid of statistics – think about what your first reaction is to the equation in Figure 1 below.
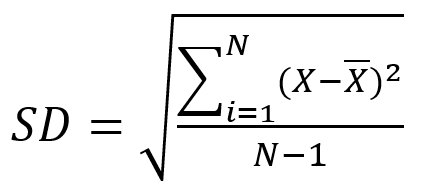
Figure 1: The equation of standard deviation (mathematical form)
This is because statistics is often misconstrued as the art of solving extremely complicated equations or a mysterious magic with numbers. Statistics, however, is first and foremost about understanding and making sense of numbers and quantitative information. For this, we need to learn the basic principles of collecting, organising and interpreting quantitative information. Critical thinking is thus much more important for statistics than the number crunching ability. After all, computers are very good at processing numbers and solving equations and we can happily leave this task to them. For example, many even complex statistical tasks can be achieved by using tools such as the Lancaster Stats Tool online, where the researcher can merely copy-paste their data (in an appropriate format) and press one button to receive the answer.
Humans, on the other hand, outperform computers in the interpretation skills. This is because we have the knowledge of the context in which numbers appear and we can therefore evaluate the relative importance of different quantitative results. We as teachers, linguists, sociologists, scientists etc. can provide the underlying meaning to numbers and equations and relate them to our experience and the knowledge of the field. For example, the equation in Figure 1 can be simplified as follows:
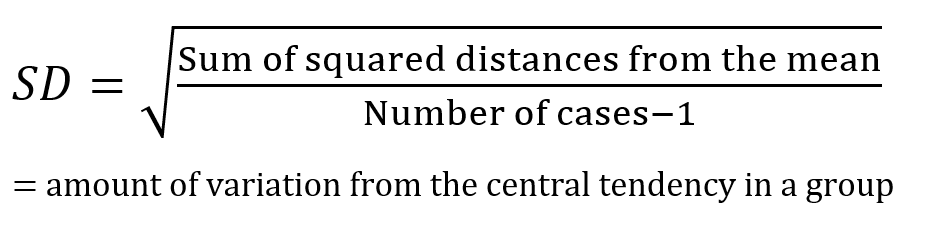
Figure 2: The equation of standard deviation (conceptual)
When we relate this to what we know about the world, we can see that the question we are asking in Figure 2 is how much variation there is in our data, a question about variability, difference in tendencies and preferences and overall diversity. This is something that we can relate to in our everyday experience: Will I ever find a twenty-pound note in my pocket? Is the wait for the bus longer in the evening? Is the number of sunny days different every year? When talking about statistics in education, I consider the following point crucial: as with any subject matter, it is important to connect statistical thinking and statistical literacy with our daily experience.
 To read more about statistics for corpus linguistics, see Brezina, V. (2018). Statistics in Corpus Linguistics: A Practical Guide. Cambridge University Press.